3rd in series of art exhibitions initiated by Goethe-Institut, hosted by GfZK Leipzig; Curatorial direction: Barbara Steiner?
Graphic Scenario 3:
Glyphs of Network-Power
...it is easier to imagine the end of the world, than the end of capitalism. Fredric Jameson
Signs and symbols of transferable, packaged digital typefaces, containing all characters and accents of the numerous languages and alphabets, are dominating today's communication.
Or to put it differently: globalised fonts are the typographic equivalent of neo-liberal concepts. System-fonts and typefaces of the new generation developed for Internet and screen, like Georgia (by Matthew Carter) and Myriad (by Robert Slimbach and Carol Twombly) have long overcome the traditional limitations of a restricted number of characters per set. Further they merge a generic, humanistic affability, well craftedness, a superiority in an optimised applicability beyond linguistic obstacles with a complete absence of vision. They are representatives of a new elasticity of signs and symbols, which are exchanged in the organic, dynamic and creative networks of ideas, projects and communities. In the practices of art and design we find the same methods of neo-liberal thinking if we look at self-initiated, emancipatory collaboration on projects, which themselves are deliberately designed to generate new projects with new collaborations, again and again. Labour and networks represent permanent stimulating acquisitions. In this context, interactive participatory work seems now almost equivalent to growth.
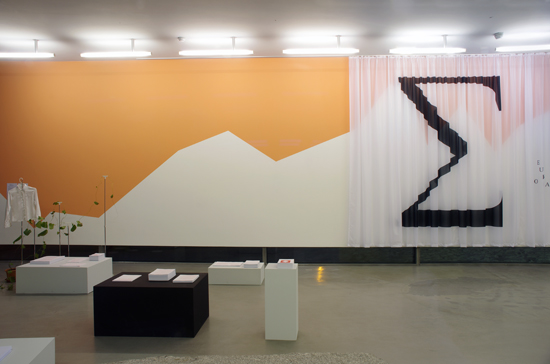
This graphic scenario does not propose an exhibition, but a set. Against the backdrop of an optimistic, post-ironical landscape, its panorama is the stylised silhouette of the exchange rate of the European joint currency to the U.S. Dollar since its introduction. Along with this, props for publishing are laid out in front of the visitor. The visual representation of data is the graphic success story of the last 10 years. Its origins can be seen in the 18th century when William Playfair took the first serious steps towards the visualisation of quantifiable data that was not just based on geographical information. In today's world info-graphics are the dynamic and amusing mediators of complex facts and their connections. If we want to articulate and negotiate a single or a multitude of ideas of Europe, we are inevitably entangled in the interpretational multiplicity of signs and symbols and their subsequent ambivalences. As the symbol for sums, the Greek capital letter Sigma describes a sequence of numbers - commonly represented by the index "i" and limited by the variable "n" - which are added up. The character Sigma can, however, depending on the scientific field, describe entirely different functions and operations. It has represented the numeric value of 200 in Ancient Greece and can also stand for a signature or a reference system or even an alphabet.
The plant Dioscera, from the Yams family, is one of the fastest growing species. Over the duration of the last Scenario-Exhibition, one scion has been growing in the greenhouse of the Leipzig Botanical Garden to the current length. In this Scenario it becomes an organic physical graph, a graphic representation of a function in a defined domain.